Customer Experience Measurement: The Right CX Metrics to Use
Pick the wrong CX metric and you'll spend years measuring something that doesn't move the business. Here's the three-layer framework, outcome, direct, driver, that ties customer experience back to revenue, and the one rule that stops it falling apart.

On this page
Creating an effective customer experience measurement framework is essential to delivering good customer experience outcomes. Only by measuring progress can you determine what is working and what needs to be changed.
In this post we review the right CX metrics to use and how to communicate them in a way that drives engagement in the customer experience process by the rest of the organisation
Measuring the Customer Experience
Great Customer Experience Measurement not only tracks the well known CX metrics like Net Promoter Score or Customer Satisfaction but also the business value outcomes of customer experience and the customer journey touchpoints that drive customer experience.
We refer to these three types of CX metrics as
- Outcome CX Metrics
- Direct CX Metrics
- Driver CX Metrics
Outcome CX Metrics: Measuring The Business Value Generated
Business value metrics quantify the value generated for the business by customer experience. Without measuring value there is no way to prove the ROI of your CX initiatives and drive on-going investment in the business
Customer Lifetime Value (CLV)
The ultimate outcome CX Metrics is Customer Lifetime Value (CLV).
CLV is the sum of the net profit a customer generates over their entire relationship with your company. It’s calculated by considering past and projected future purchases, minus the costs of delivering those purchases and acquiring the customer.
Converting the above definition to a formula for CLV we get the following:
Customer Lifetime Value Formula
Where:
- t is the year (1,2,3,4, etc) in which the Gross Margin is received and Servicing Cost is paid.
- i is the annualised Weighted Average Cost of Capital – this is a finance term that has a similar meaning to the interest rate on a loan. Ask your finance team what this number is for your company.
While the concept is straightforward, calculating CLV can be challenging due to uncertainties in future purchases and difficulties in assigning exact costs to each customer. The calculation method also varies depending on whether you have contractual or non-contractual relationships with customers, and whether transactions are discrete or continuous.
Key factors that influence CLV include retention rate, gross margin, servicing costs, and customer acquisition costs. By focusing on improving these areas, businesses can increase their overall Customer Lifetime Value.
There are only three ways to lift CLV, so we also need metrics that address each of these drivers:
- Sales: Increase per customer sales
- Loyalty: Retain customers longer
- Cost: Lower the cost to serve

The only ways to drive Customer Value
Sales Metrics: Increasing Per Customer Sales
Metrics that capture sales per customer include:
- Cross-sell Rate – this is often reported as the easy to calculate “average number of products per customer”
- Up-sell rates – selling more of the same product or service to the same customer
- Monthly Recurring Revenue Growth: SaaS companies in particular track up-sell rates in terms of MRR Growth and use revenue recognition tools such as Younium, Zuora and Synder to accurately keep track of revenue growth.
Loyalty Metrics: Keeping Customers Longer
Commonly customer loyalty metrics include;
- Product Retention rate: how long does a customer use each product or feature
- Customer Retention Rate: what proportion of customers leave each year
- Average Customer Tenure: how long do customers stay with the business.
Changes in these rates can be directly linked to business value generated using Customer Lifetime Value calculations.
Direct CX Metrics: Measures of the Customer Experience
CX Direct Metrics are an attempt to quantify the elements of the customer experience that drive the CX Outcome Metrics. In that way they are attempts to measure the CX itself.
The most common element companies want to predict is Customer Loyatly. This drives both current customer value and also future customer value.
There are three Direct CX Metrics in common use:
Net Promoter Score
Net Promoter Score, or NPS® is well known and has been proven to be a valid predictor of customer loyalty.
To determine NPS® the following question is added to an organisation’s customer feedback survey.
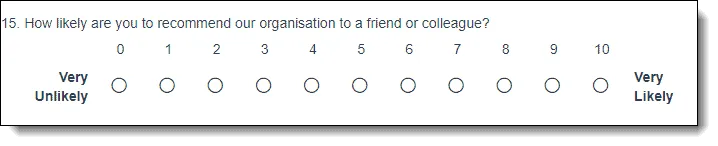
The Net Promoter Score Question
Once the data is collected, Net Promoter Score is calculated by subtracting the percentage of 0-6 responses (Detractors), from the percentage of 9 and 10 responses (Promoters). 7 and 8 responses (Neutrals) are ignored.
Here is the NPS calculation in a formula:
The Net Promoter Score formula
Customer Satisfaction Score or CSAT
Customer satisfaction scores and customer satisfaction indices are an attempt to measure how satisfied customers are with the performance of the company. The assumption being that the more satisfied a customer is the more likely that are to stay as a customer.
Unfortunately, research indicates that the simple average CSAT is a poor predictor of customer loyalty.
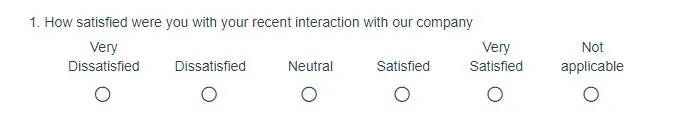
Customer Satisfaction Question
Customer Effort Score
Launched in the 2010 Harvard Business Review article “Stop trying to delight your customers”, Customer Effort Score (CES) is less popular than NPS and has it’s fair share of criticism.
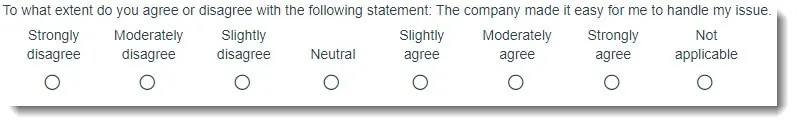
Customer Effort Score Question
It has been shown to be a good predictor of customer loyalty but is generally only applicable to front line (contact centers, retail locations, etc) settings.
Driver CX Metrics: Measuring what Drives Customer Experience
Goaling staff on improving the CX Direct Metrics is bound to fail unless it is made clear how to improve them.
This is the role of CX Driver Metrics – they link internal business processes with the Direct CX Metrics.
For example, if your root cause analysis process has uncovered that a low First Call Resolution rate is driving down NPS and customer loyalty you can add First Call Resolution to the CX metrics you track. This focuses the organisation on improving the internal metrics that will have the most impact CX.
Unlike Direct CX and Outcome CX metrics, Driver CX metrics may evolve and change over time as your business analysis highlight different areas that need to be addressed.
The Driver CX measures are typcially related to processes and customer journey touchpoint.
Examples of Driver CX measures include:
- First call resolution
- Average Handle Time (shorter is not necessarily better)
- Proposal accuracy
- Shipping accuracy
- Order to Ship time
- Average ticket resolution time
CX Measurement Best Practices
Here are 5 best practices you should apply to the design and delivert you the CX measurement process.
Use only One Direct CX Metric
It is sometimes tempting for organisations to use multiple direct CX metrics: NPS and CES and CSAT.
This seems like it create more diagnostic information but in practice it often just creates confusion.
Internal discussions and disagreements over why a particular metric changed, or didn’t change versus the other metrics take up more time and effort than driving change.
Consistency
Create your measurement framework and report against it every week or month so the rest of the organisation becomes accustomed to seeing the data an understanding what it means.
This also allow you to develop trends that are useful in the next best practice.
Actively Distinguish Signal from Noise
Clearly identify which movement in the CX metrics are more likely real and which are more likely due to statistical variation. This gives people confidence in the data and the actions they may be taking.
The is particularly important for survey data. Surveys are samples and so subject to statistical error.
If you don’t clearly identify what is more likely a “real change” and what is more likely just statistical variations the organisation will lose confidence in the reporting.
The statistical analysis of survey data is not difficult but it does need to be part of your CX measurement process.
The statistical treatment of NPS is unusual and you should review that in detail.
Share CX Data Broadly Across the Organisation
Share the data as widely as possible across the organisation. There is very little downside in sharing it and the upside is enormous.
When you share the details of what you’re doing and what you’re looking to achieve with everyone they will understand the bigger strategy and will be more engaged in the process.
Create an Integrated CX Measurement Framework
It’s important not to have too many metrics as you can spend more time reporting than making changes but you do need measures in three distinct aspects of the customer experience noted above.
Customer Experience Measurement Framework
Having decided on the important metrics it’s useful to report them to the rest of the organisation in a cohesive CX Measurement Framework.
Here is an example CX Measurement Framework:

Example CX Measurement Framework
In this example you can see that each of the types of customer experience measurements are included. It also shows how the measurements are linked together to form a cohesive strategy.
Customer Experience Measurement FAQs
What types of metrics measure customer satisfaction?
There are several metrics that can measure customer satisfaction, such as Net Promoter Score (NPS), Customer Satisfaction Score (CSAT), and Customer Effort Score (CES). NPS measures the likelihood of customers recommending a company to others, CSAT measures overall satisfaction with a specific interaction or experience, while CES measures the level of effort required by customers to achieve their goals.


![[Case Study] How AccessPay Lifted NPS from 15 to 50 in 2 Years](/_astro/accesspay-nps-chart.D6s0WUCj.svg)