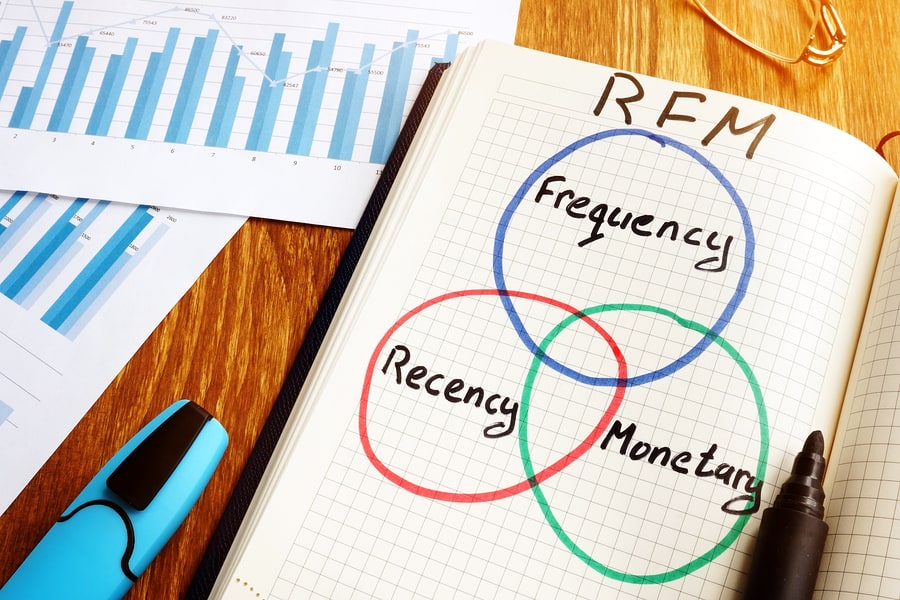
Net Promoter® Links to Recency-Frequency-Monetary (RFM)
Database marketers have used Recency-Frequency-Monetary scoring since direct mail was the cutting edge, and Recency is consistently the best predictor of response. So how does NPS link to RFM? It turns out there's a clear, useful overlap that lets you combine both signals to predict next-best customer behaviour.
From the early days of data-driven marketing, it has been known that marketers can predict which customers are most likely to respond to an offer by ranking them on the basis of;
- how Recently they have transacted with you
- how Frequently they have transacted with you
- how much money (Monetary) they have spent with you.
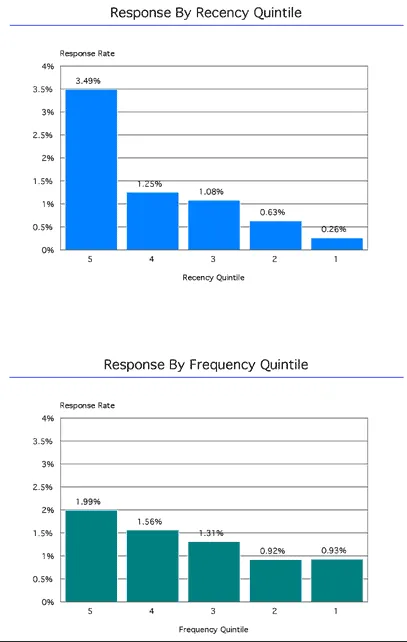
It is also well known that of the 3: RFM, Recency is the best predictor of future business. My favourite database marketing guru, Arthur Hughes says;
Frequency is often a powerful predictor of response, but it is seldom as powerful as Recency. We can easily illustrate the differences by comparing the response rates of the same group of people based on their recency and their frequency
So the customers most likely to be positive towards your product or services, those most likely to respond to your next offer, are those customers who have transacted with you most recently.
Nothing new there, but it has occurred to us that as NPS® also predicts future sales we should expect a recency effect in transactional (bottom up) NPS scores.
I was reading a thread in the LinkedIn Net Promoter Community where Paul Sherland asks the question;
“…do you notice a time dependency in the [NPS] responses? My impression is that loyalty fades if it’s not reinforced by new engagement with the brand.”
John Abraham of Satmetrix responds (July 6, 2010) with;
“Your question about recent engagement is an interesting one. I have not analyzed this within our benchmark, but I have seen companies using NPS present findings at our conferences that match what you describe. Charles Schwab and Bain & Company did a joint presentation at our conference in San Francisco in January 2009 which mentioned the same phenomenon. Higher scores immediately after a branch visit, and then a drop off with time until another interaction occurs.”
So on the surface NPS and Recency cross-foot.
There is a lesson here for bottom up NPS.
Bottom up (also called transactional) NPS involves asking the NPS question close to a ‘Moment of Service Truth’ so you can translate customer feedback into tactical process improvements. If the score you receive partly depends on when you ask, make sure you are consistent in your timing. Preferably ask the NPS question as close in time as possible to the service experience you are improving, consistently, or your results will be distorted by recency differences.