NPS Surveys: Should you report based on “sent date” or “received date”
Should NPS be reported by the date the survey went out, or the date the response came back? It feels like a small reporting decision, until the wrong choice quietly distorts your trend line for months. Here's the case for each side and why "received date" is usually the right answer.

On this page
Recently, a customer asked, “In terms of “best practice”, do you have a view on whether Net Promoter Score should be calculated based on the date a survey was sent or the date of the response?”
My response was perhaps not as specific as they had hoped : “It depends.”
Understanding Net Promoter Score (NPS)
Before we delve deeper into the complexities of reporting dates for surveys, lets cover the fundamental concepts of the Net Promoter Score (NPS).
The NPS is a widely adopted metric used by businesses across industries to measure customer loyalty and satisfaction. This score is calculated based on responses to a single question:
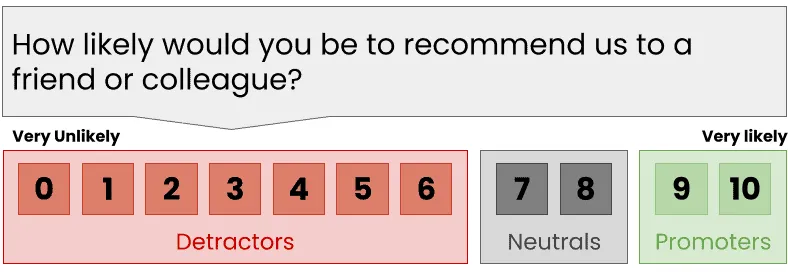
The NPS Question
The responses are then categorized into three groups: Promoters (9-10 score), Passives (7-8 score), and Detractors (0-6 score). The NPS is then calculated by subtracting the percentage of Detractors from the percentage of Promoters.
NPS is a simple, yet powerful tool to gauge customer sentiment towards your brand, products, or services. It helps businesses identify areas of improvement, evaluate customer loyalty, and predict growth. By monitoring NPS, companies can take targeted actions to enhance customer experiences, foster loyalty, and ultimately drive growth.
Pros and Cons of Using Sent Date for NPS Calculation
Pros of Using Sent Date:
Tying Score to An Execution Period: Using the sent date offers a clear timeline, making it easier to associate the score with a particular period.
This can potentially tie customer scores to specific events or changes in your business or the market, allowing you to better understand the impact of these events on customer sentiment.
Cons of Using Sent Date:
Delayed Responses: One potential drawback is that customers might respond to surveys after a significant delay.
This means that their feedback would be associated with the time the survey was sent rather than when they actually responded, which might not accurately reflect the current business performance.
Inconsistent Monthly Reports: If customers respond to surveys in the following month, the NPS for a particular month might not include these late responses. This means scores for a period can change after the period ends.
Pros and Cons of Using Completed Date for NPS Calculation
Pros of Using Completed Date:
- Current Sentiment Analysis: Using the completed date helps ensure that the NPS score reflects the customer’s sentiment at the time they actually responded.
- Synchronicity with Other Metrics: If you’re tracking other metrics based on completed dates (like sales conversions or support tickets), this method will align your NPS data with these other metrics, making it easier to correlate data across different areas of your business.
- Consistent Scores: Once the period ends the score is set and scores don’t change in the days after the end of the period. These changes, while technically correct, can raise questions and invite unwarranted investigation
Cons of Using Completed Date:
Tying Score to Receipt Period Not Execution Period: Score are not tied to your operating business but to the date responses are received. If you have a fast and large change in the operating business or market this might somewhat mask the impact on customers.
However, because we’re most often talking about email surveys this effect is generally quite small. Email surveys are normally done within a day or two of being sent so within a couple of days the impact will be seen.
Recommendation: Generally You Should Use “Received Date”
In many ways, it doesn’t matter which you choose so long as you stay with the same date. The client at the start of this post was concerned about being “most accurate” when calculating the score but this is a fuzzy concept here.
“Most consistent” is probably more useful idea in this case.
A consistent NPS data collection process is key in obtaining data that you can trust and action.
See this blog post for more on this topic: How to Set Net Promoter Score® Targets For Your Staff and Company.
In the normal course of business I recommend using “Received Date”, mostly because scores don’t change after the end of the period. This is un-settling for most businesses, particularly where there is some type of incentive or bonus on NPS. (Even though I personally discourage this).
If you have a major execution period event you can use “Sent Date” in the analysis of that incident to extract the advantages of tying scores to the execution period.


![How to Analyse Survey Data in Excel [+Video]](/_astro/how-to-analyze-surveys-in-exce-opt-e1607575803448.ZxA-rJo-.jpg)