
Free tool
Online NPS Calculator with Margin of Error
Enter your promoter, neutral and detractor counts to see your score and its margin of error, then compare two samples to find out if a change is real or just statistical noise.
Your NPS and margin of error
Net Promoter Score
33
Margin of error: ±10.1 points
With 240 responses, an NPS of 33 has a margin of error of ±10.1 points, so the true score is likely between 23.2 and 43.4.
Compare two samples
Has your score really changed between two periods, or two segments?
Margin of error test: has it changed?
No
The 4.2-point difference is within the 4.3-point margin of error, so this could just be sampling noise.
Chi-squared test: has the mix changed?
No
We can't be 95% sure this is a real shift, it could still just be sampling noise.
Want to see the working? Read how these formulas work.
Free NPS Statistics SpreadsheetWhat is Net Promoter Score?
Net Promoter Score, or NPS®, is a customer survey question and analysis approach used by companies, large and small, to measure customer experience and predict customer loyalty.
While there are many reasons why NPS is important, its main benefit is that a company’s Net Promoter Score versus its competitors is a predictor of future business revenue growth.
NPS is often used as a key metric in Voice of the Customer programs.
The Net Promoter Score Question
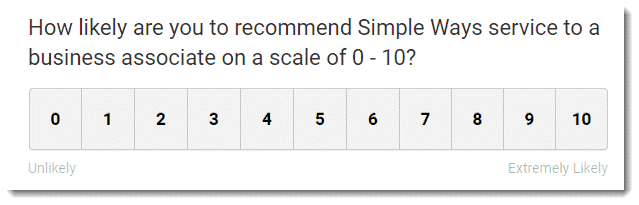
To determine NPS® the following question is added to an organisation’s customer feedback survey.
The response is scored on an 11 point scale from Very Unlikely (0) to Very Likely (10).
How to Calculate Net Promoter Score
Once the data is collected, Net Promoter Score is calculated by subtracting the percentage of 0-6 responses (Detractors), from the percentage of 9 and 10 responses (Promoters) to the “Would Recommend” question in your survey. The 7 and 8 responses (Neutrals) are ignored.
The overall score is then between -100 and +100.
So, in NPS parlance:
- Anyone that gave you a 0-6 is termed a Detractor;
- Anyone that gave you 7 or 8 is termed a Neutral; and
- Anyone that gave you 9 or 10 is termed a Promoter
And, Net Promoter Score = Percentage of Promoter Responses – Percentage of Detractor Responses
Here is the NPS calculation in a formula:
The Net Promoter Score formula
Calculating NPS in Excel or Google Sheets is very simple and typically uses the COUNTIF function.
Or you can use the online NPS calculator on this page.
NPS Survey Design
Because the approach is seemingly so simple, just one question, many organisations start to use it by just adding the “would recommend” question to their existing surveys believing this is all that is needed. This is a mistake and does not work because it just tells you the current value, not how to improve.
When you implement Net Promoter you need to collect not just the “would recommend” rating but also the reasons for the rating.
You can do this in several ways;
- qualitative feedback,
- additional scored questions,
- tagging of responses,
- etc.
However you do it, the why part of the feedback is essential to your success.
Survey Design Resources
- Net Promoter Score® Survey Design and Examples
- Customer Loyalty Surveys: Do you include all 3 critical elements?
- Customer Feedback Surveys: The 6 TRACER Attributes
- Double Barrelled Questions: How to Identify & Fix Them
- Biased Questions: How to Identify & Fix Them
- Every survey design article: question wording, scales, survey length and the mistakes that quietly skew your results.
Why Net Promoter Score is Important for a Business
The primary reason that NPS is important is that it is an easy-to-use predictor of customer loyalty.
For this reason Customer Success Managers will often use it as one of their KPIs.
And companies who use NPS to focus their business improvement process see returns over and above the average.
There are many case studies to demonstrate these links.
- A sustained one percentage point lift in NPS across all UK stores was worth about 0.5% of annual revenue to furniture retailer DFS, roughly £3 million a year and more profit than opening a new store.(source)
- Philips Lighting tracked NPS account by account: where the score rose, revenue grew 70% on average; where it fell, revenue declined 24%.(source)
- SmartBear turned promoter feedback into US$6 million of referral business within a year, closing at 47%, and lifted its save rate on at-risk accounts to 60%.(source)
- Across seven US sportswear brands holding two-thirds of the market, a one point rise in NPS preceded 1.458 percentage points of sales growth the following quarter.(source)
- Reichheld's FREDSI portfolio of industry NPS leaders returned 10.1 times over ten years against the Vanguard Total Stock Index's 3.6 times.(source)
- Every NPS case study: named companies, real numbers, and links back to the original source in each case.
Relationship vs Transactional NPS Surveys
There are two ways to collect NPS data.
Relationship Surveys
The purpose of a Relationship Net Promoter Score survey is to identify how your business compares with its competitors with respect to overall customer loyalty and the drivers of overall customer loyalty. It is a way to benchmark your company against its competitors.
Relationship NPS surveys are performed on a regular basis, say every 6 or 12 months. They measure your organisation’s overall score.
Advantages of Relationship surveys
- They give you understanding of your overall standing with the client
- They can be compared to other organisation scores to benchmark your progress. Note that you need to be very careful doing this, but it can be done.
Disadvantages of Relationship Surveys
- It can be difficult to understand how to act on the feedback that is received.
- The process sometimes only generates results on a 6 monthly or annual basis.
Transactional Surveys
The purpose of a Transactional Net Promoter Score survey is to measure the NPS of each customer transaction and gather information about what customers liked and disliked during that interaction. This data can then be used to make improvements to the touchpoints in the customer journey and ultimately improve the overall NPS for both the transaction and the relationship with the customer.
Transactional surveys occur after a customer has been through an interaction with your business. It could be a sale, business process or customer service interaction.
Advantages of Transactional surveys
- They tend to be more actionable because they relate to a specific interaction. That way you can summarise all the data around an interaction and make improvements
- They provide an ongoing data stream that helps with organisation engagement
- They tend to revolve around times when a customer’s perception of your business changes so are very relevant. It’s mostly at these interactions that customer loyalty will be improved (a good interaction) or destroyed (a bad interaction)
Disadvantages of Transactional Surveys
- It’s very difficult to compare data with other companies because of the specific nature of each interaction.
The Origins of Net Promoter Score
The approach was first presented in a Harvard Business Review article titled: The One Number You Need to Grow in December 2003. The author of the article, Fred Reichheld, was well known in the customer loyalty industry and had performed some unique research.
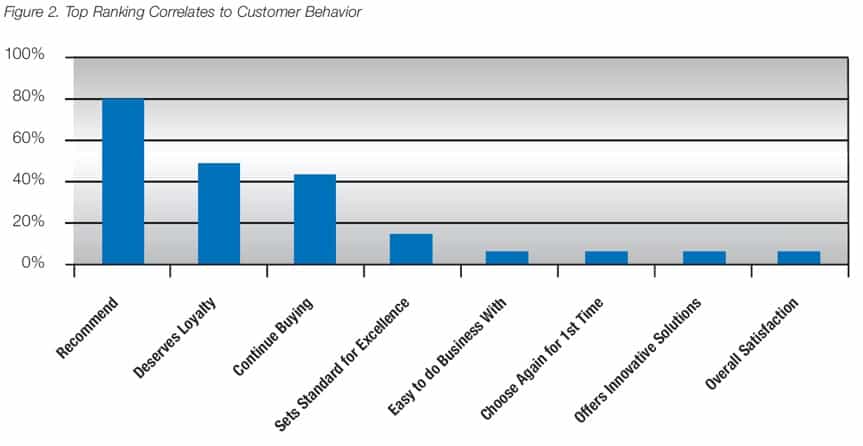
He wanted to find out if one question could be used to predict a customer’s loyalty. So he asked tens of thousands of customers, lots of different questions, and then cross-referenced their loyalty using actual purchasing data.
By testing different approaches, empirically, he discovered that NPS was most often the best indicator of customer loyalty.
Until that time organisations had been using “customer satisfaction” or complex calculations of several different variables to try to predict loyalty. In general customer satisfaction was found to be quite a poor predictor of customer loyalty. The other approach, complex calculations, was found to be accurate but difficult to implement and understand.
In identifying the simple approach, Reichheld had identified an easy to use metric that actually predicted customer loyalty.
Employee Net Promoter Score (eNPS)
Employee Net Promoter Score®, or eNPS, is used increasingly often in company reports because it is a way to:
- Lower organisation costs by reducing employee turnover and the associated business impact
- Increase customer loyalty through higher employee engagement.
It uses the standard NPS question, just tweaked a little to be focused on the organisation’s employees not its products and services.
eNPS Resources
Net Promoter Score Survey Software and Tools
While the formula to calculate NPS is simple, operationalising it in your business is much more complex. You need to consider:
- Automatic sending
- Real-time reporting
- Driver and Root Cause analysis
- Time series data analysis tools
- Segment data analysis tools
- And more…
Market research style survey tools, SurveyMonkey, et al., are great for one-off surveys but lack the features needed operationalise and drive business success.
A dedicated NPS software platform is a better choice.
NPS Software and Tool Resources
- NPS Software: Buyers Guide
- NPS Software: CustomerGauge
- How to Calculate NPS in Excel
- How to Collect Transactional NPS Data
- How to Automate NPS Data Collection
- Every NPS tools and software article: buyers guides, platform comparisons and how to get the data out of them.
NPS Statistical Data Analysis and Interpretation
If you’ve ever done a statistics course (at any level) you will have heard of sampling and confidence intervals. These terms help you to understand how closely the responses you receive match the overall population.
Unfortunately, because NPS is a net score (remember, Promoters – Detractors) the calculations are a bit different to those we do on other survey data.
Those calculations are not difficult but the concepts need a little explaining. Grab one of the resources in this post for a detailed explanation or download the spreadsheet which has the calculations already done for you.
NPS Data Analysis Resources
- Did my NPS really, really change?
- Calculating NPS Margin of Error
- Zero is a Special Net Promoter Number
- The 9 Elements Your NPS® Report Must Have
- Combining Kano and Net Promoter Analysis
- Every NPS analysis article: statistics, segmentation, reporting, and what the numbers will and will not support.
NPS Benchmarks: What is a Good Score?
It’s common for companies to wonder how good their score is.
In practice this is a very difficult question to answer because so many factors can affect the score.
So external benchmarks can be difficult to find and apply to your specific business.
On the other hand internal benchmarks are very effective. In this case a good Net Promoter Score is one that is better than you had last quarter, month, year.
“Good” is any score that is continuously improving.
NPS Benchmark Resources
- Don’t Waste Your Time On External Data
- Stop giving people NPS targets
- What is a Good Net Promoter Score? [Video]
- Take Care When Comparing Net Promoter
- Net Promoter Score Case Studies With Links to Business Value
- How Much Can You Improve – Real Company Data
- Europe vs Australia: NPS Benchmarks
- Every NPS benchmark article: what a good score looks like, setting targets, and the limits of external comparison.
Criticism of Net Promoter Score
Just like any system, there are proponents and detractors for the use of the score. As a high-profile-system it has been researched substantially and much of the work published.
Criticism & Alternative Resources
- Net Promoter Score Research: "For" and "Against"
- Net Revenue Score is not a new Net Promoter Score
- Every article on NPS criticism and validity: the academic case against the score, and where it holds up.
- Every NPS alternatives article: CSAT, Customer Effort Score and the rest, with the cases where each is the better fit.
Net Promoter Score Alternatives
There are only two NPS alternatives that are in common use as of 2026.
NPS Alternative: Customer Effort Score
Launched in the 2010 Harvard Business Review article “Stop trying to delight your customers”, Customer Effort Score (CES) is less popular than NPS and has its fair share of criticism.

NPS Alternative: Customer Satisfaction (SAT)
Customer Satisfaction has been used in customer feedback surveys for decades. The question is worded thus:

Implementing NPS
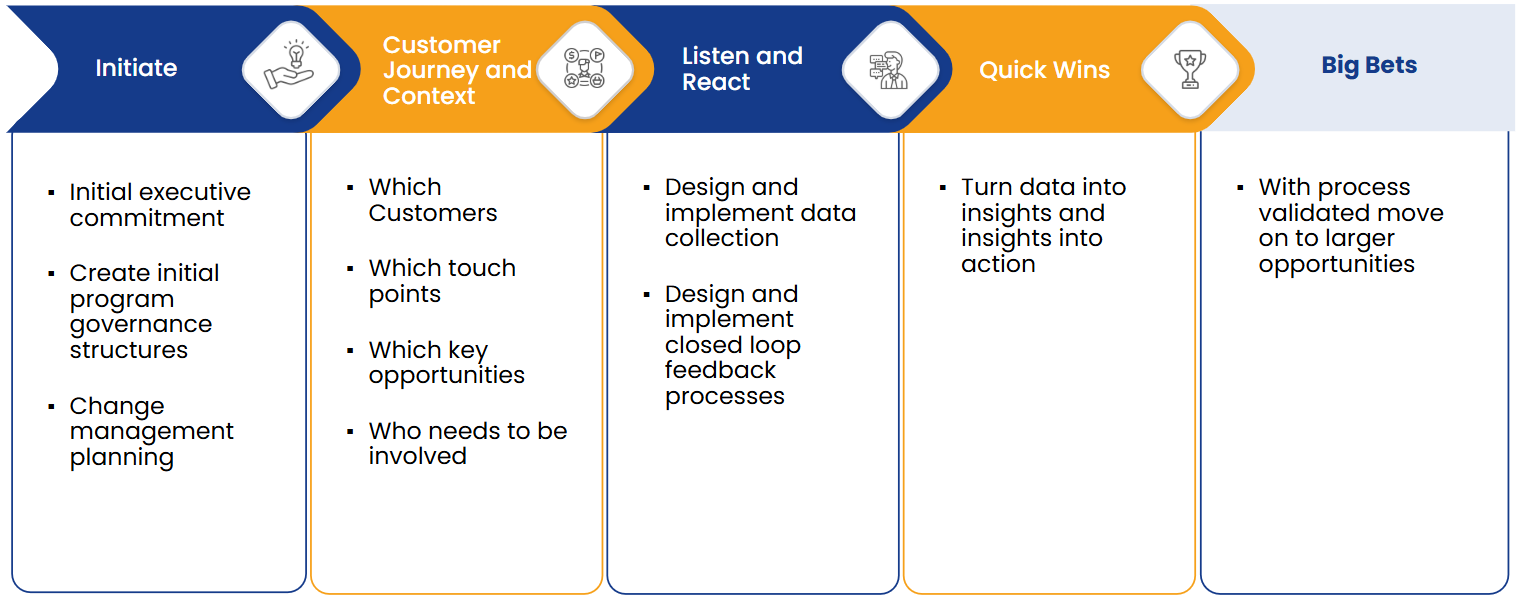
Successful NPS implementation is more than adding a new question to your existing customer feedback survey. There are eight steps to properly launch it in a business.
The summary is below but we have a deep dive on this process here: The 8 Steps to Best Practice Net Promoter Score® Implementation
Step 0. Demonstrate The Business Value of NPS and Secure Your Executive Champion
To be successful long term you need a senior executive champion to knock down the roadblocks that will inevitably come up.
Step 1. Initiate
Confirm senior management buy-in and create the company structures that you need to drive change. You will also need to consider the change management.
Step 2. Customer Strategy and Context
Analyse your customer journey to design your data collection process:
- Which customers will you survey?
- Which touch-points are important?
- Where are your key opportunities to improve the business?
Step 3. Design The Survey & Data Collection Process
Only now do you get down to the business of survey design and implementing your data collection process.
Step 4. Close the Loop With Customers
If you are implementing Transactional NPS then you have a very powerful customer loyalty opportunity from day one: Service Recovery.
Step 5. Identify and Execute on some Quick, Impactful Business Improvements
Rather than trying for a big-bang win that may be high risk or long term, use processes like the 5 Whys to look for some quick wins that will get runs on the board right now.
Step 6. Deeper Analysis to Drive Big Changes
When you have been running the data collection process for 6-12 months and you have made quite a few small changes you will be more confident in the data and in your analysis. This is the time to look for some Big Bets.
Step 7. Repeat: the Listen, Analyse, Act Loop
Now that you have the basic process down you simply need to repeat the listen, analyse, act loop.
NPS Best Practices and Action Planning Resources
- Every NPS best practice article: how the strongest programmes are run, from survey design through to closing the loop.
- Every NPS action plan article: turning collected feedback into improvement projects that actually ship.